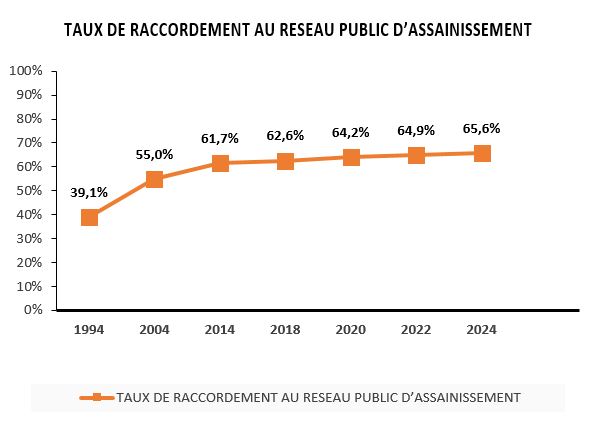
TAUX DE RACCORDEMENT AU RESEAU PUBLIC D’ASSAINISSEMENT
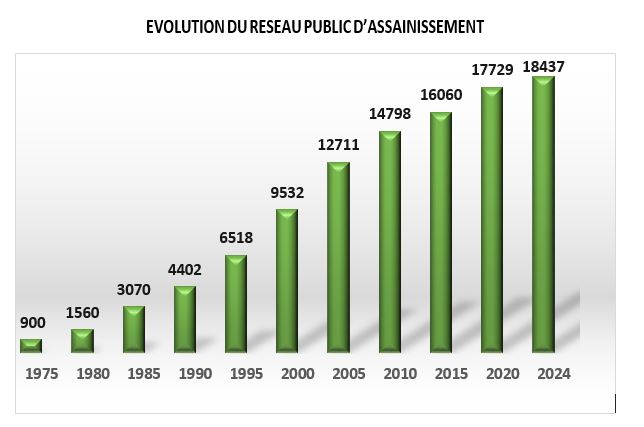
EVOLUTION DU RESEAU PUBLIC D’ASSAINISSEMENT
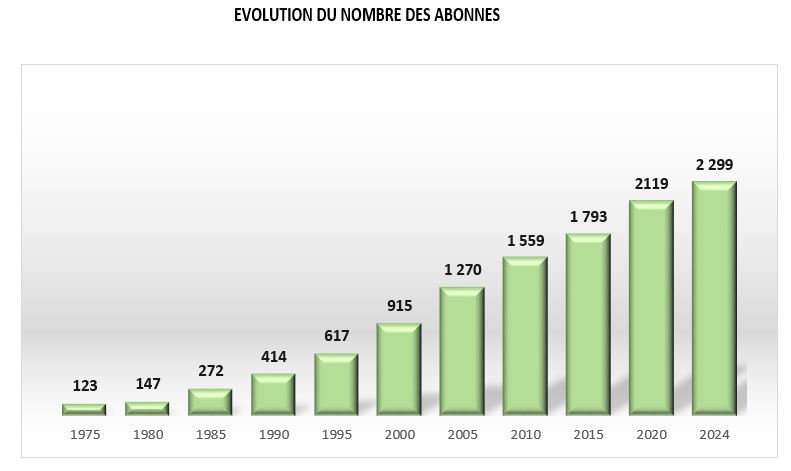
EVOLUTION DU NOMBRE DES ABONNES
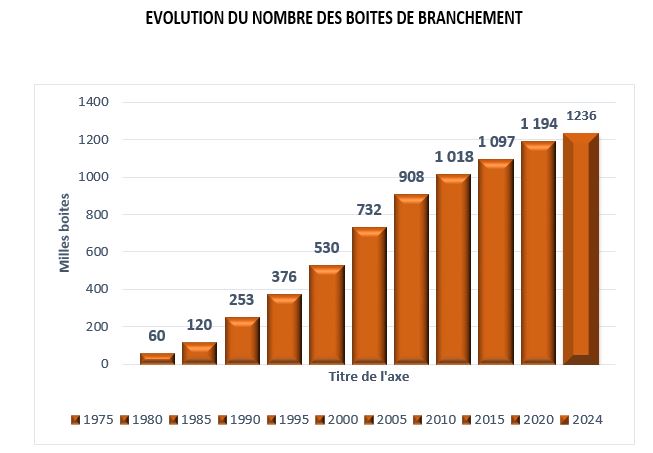
EVOLUTION DU NOMBRE DES BOITES DE BRANCHEMENT
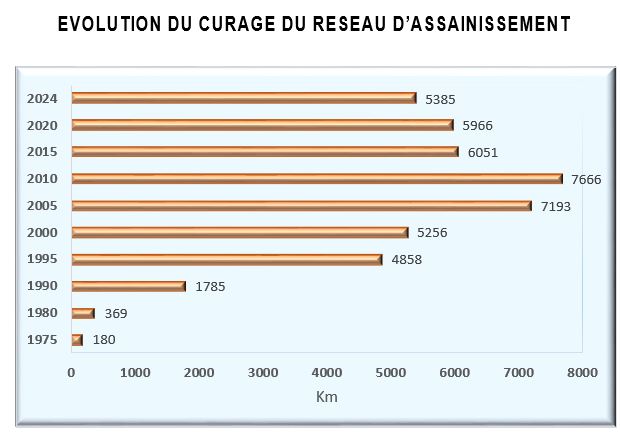
EVOLUTION DU CURAGE DU RESEAU D’ASSAINISSEMENT
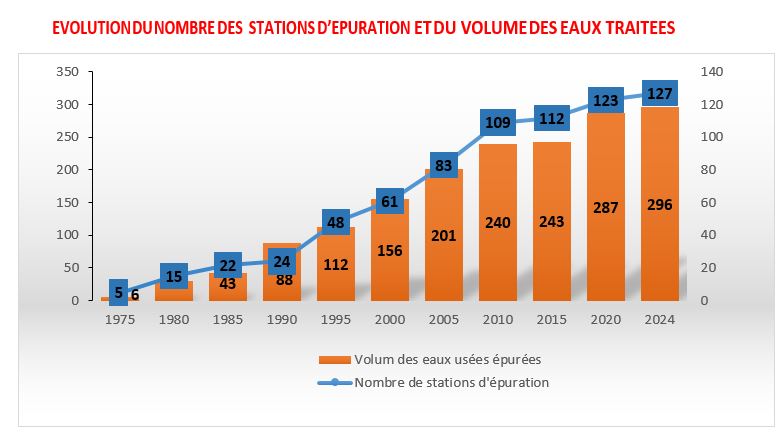
EVOLUTION DU NOMBRE DES STATIONS D’EPURATION ET DU VOLUME DES EAUX TRAITEES
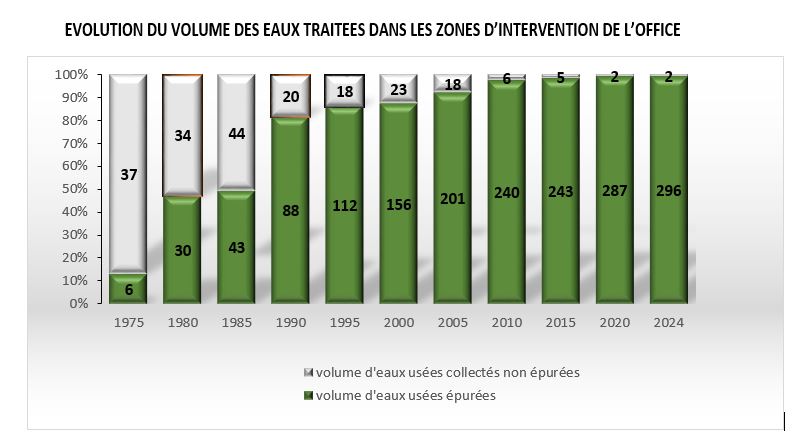
EVOLUTION DU VOLUME DES EAUX TRAITEES DANS LES ZONES D’INTERVENTION DE L’OFFICE
PRINCIPAUX INDICATEURS DE L'ASSAINISSEMENT
|


|
| Indicateurs |
Unité
|
2020
|
2021
|
2022
|
2023
|
2024
|
| Nombre de municipalités dans l’ONAS (*) |
Municipalité
|
193
|
193
|
193
|
197
|
197
|
|
Taux de raccordement au réseau public
|
%
|
64,2%
|
64,5%
|
64,9%
|
65,4%
|
65,6%
|
|
Taux de raccordement au réseau public d’assainissement (**)
|
%
|
77,9%
|
78,3%
|
78,8%
|
78,9%
|
79,1%
|
|
Nombre d’abonnés
|
1000 abonnés
|
2119
|
2157
|
2200
|
2257
|
2299
|
|
Volume des eaux usées
|
Million m³
|
312,5
|
317,5
|
318,5
|
311,0
|
313,4
|
|
Longueur du réseau
|
Km
|
17729
|
17848
|
18038
|
18243
|
18437
|
|
Nombre d’égouts
|
1000 égouts
|
1193647
|
1202710
|
1215184
|
1226433
|
1236440
|
|
Réseau public d’assainissement
|
Km
|
5966
|
5653
|
5600
|
5425
|
5385
|
|
Taux du réseau d’assainissement
|
%
|
44,6%
|
41,9%
|
40,7%
|
38,9%
|
38,2%
|
|
Nombre de stations de pompage
|
Station
|
812
|
815
|
824
|
837
|
841
|
|
Nombre de stations d’épuration (STEP)
|
Station
|
123
|
125
|
125
|
127
|
127
|
|
Volume des eaux usées collectées
|
Million m³
|
289,3
|
290,9
|
294,5
|
296,1
|
298,2
|
|
Volume d’eau traitée dans les STEP
|
Million m³
|
286,8
|
288,5
|
292,1
|
292,8
|
295,7
|
|
Taux de traitement des eaux usées
|
%
|
99,1%
|
99,2%
|
99,2%
|
98,9%
|
99,2%
|
|
Nombre d’interventions sur le réseau
|
Intervention
|
115183
|
115045
|
109666
|
100828
|
111396
|
|
Nombre d’interventions par km
|
Intervention/km
|
6,5
|
6,4
|
6,1
|
5,5
|
6,0
|
|
"Les chiffres définitifs utilisés dans ce site sont arrêtés le mois d’avril de chaque année"
|